How do global trade dynamics affect risk, investment, and insurance? This article uses the lens of comparative advantage and full employment to explore the economics of trade—and why it matters to actuaries.
By Carlos Fuentes
Editor’s Note: This is the first in a two-part series exploring how global trade dynamics influence risk, investment, and insurance. A follow-up article will focus on trade under conditions of unemployment and tariffs, examining the resulting implications for risk and policy.

At least half of the popular fallacies about economics come from assuming that economic activity is a zero-sum game, in which what is gained by someone is lost by someone else.
But transactions would not continue unless both sides gained, whether in international trade, employment, or renting an apartment.—Thomas Sowell
International trade is best understood as the movement of goods, services, and capital across borders—a process that binds economies together and deepens global interdependence. At its foundation lies the principle of comparative advantage: Nations specialize in what they can produce most efficiently, exchanging those outputs for goods and services that would be costly or impractical to generate domestically. This specialization is not merely a technical arrangement; it is one of the engines of globalization, driving productivity gains, innovation, and the diffusion of prosperity.
The efficiency gains from trade are evident in the way countries align production with their strengths. Tropical economies channel resources into crops such as coffee or fruit, while technologically advanced nations export machinery and electronics. These exchanges create reciprocal benefits, broadening consumer choice and lowering costs, while raising living standards through access to a wider array of competitively priced goods. Trade also intensifies competition, compelling firms to innovate, improve quality, and expand into new markets. For developing economies, integration into global commerce can serve as a pathway to industrialization, foreign investment, and long-term growth.
Yet the benefits of trade are tempered by its vulnerabilities. Disparities in economic power can foster exploitation or asymmetrical agreements. Tariffs, quotas, and other barriers disrupt flows of goods and services, often escalating into geopolitical friction. Heavy reliance on global supply chains exposes economies to shocks—whether natural disasters, pandemics, or political conflict—that reverberate far beyond national borders.
Underlying these dynamics are financial theories that explain how capital flows, exchange rates, and trade balances interact with risk management. For financial professionals, fluency in these concepts is essential. Actuaries, in particular, have a role to play in quantifying and mitigating the risks that arise from tariff-driven volatility. Such volatility can elevate claims costs, compress investment returns, and constrain diversification, with direct consequences for insurers and public finances. Inflation and unemployment—sometimes the byproducts of protectionist measures—further complicate actuarial assumptions, influencing discount rates, benefit indexing, and stress-testing frameworks.
This article draws on established economic theory, which explores international trade in two parts. First, it frames trade in the context of the production possibility curve, which provides the conceptual tool for later arguments. Second, it examines trade under conditions of full employment, drawing on the theory of comparative advantage. A subsequent article will broaden the discussion to encompass trade in the presence of unemployment and the strategic deployment of tariffs, highlighting how deviations from idealized assumptions shape trade policies.

Unemployment is rarely considered desirable except by those who have not experienced it.
—John Kenneth Galbraith
Considerations on Unemployment
Measuring Unemployment
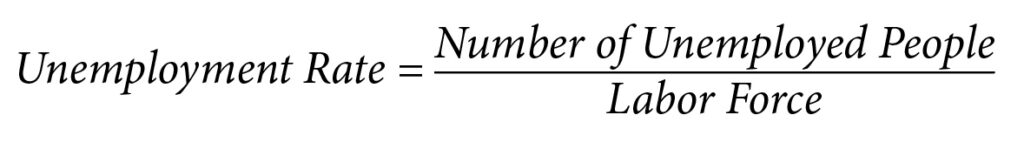
Unemployment is quantified through large-scale surveys conducted by national statistical agencies such as the U.S. Bureau of Labor Statistics (BLS). The most familiar indicator—the unemployment rate—measures the share of the labor force that is actively seeking work but remains without employment. Formally, it is expressed as:
The definition of the labor force is deliberately narrow. It includes individuals aged 16 and older who are either employed or actively searching for work, while excluding retirees, students outside the labor market, and those unwilling or unable to participate. Informal employment, though often precarious and outside the reach of taxation or social protection, is nonetheless counted.1 To qualify as unemployed, individuals must demonstrate active job search efforts within the preceding four weeks. In practice, governments rely on instruments such as the Current Population Survey to generate these estimates.
Yet these statistics are imperfect. They fail to capture underemployment—workers employed part-time involuntarily or in roles that underutilize their skills—and they omit discouraged workers who have abandoned the search for jobs altogether. As a result, unemployment figures often understate the extent of labor market slack.
Defining Low Unemployment
The notion of “low” unemployment is context-dependent, shaped by historical benchmarks and the structure of individual economies. In advanced industrial nations, rates below 4% are generally interpreted as signs of a strong labor market, approximating what economists call “full employment.” This concept allows for frictional unemployment—the natural churn of workers moving between jobs—but implies that the economy is operating near capacity.
Still, very low unemployment is not an unqualified good. When labor markets tighten excessively, several distortions emerge:
- Labor scarcity. Employers struggle to fill vacancies as the pool of available workers shrinks.
- Inflationary pressures. Competition for scarce talent drives wages upward; higher labor costs are often passed on to consumers, fueling inflation,
- Productivity concerns. Firms may be forced to hire workers whose skills do not align with job requirements, reducing efficiency.
- Economic inefficiencies. Overextended resources and mismatched labor allocation hinder optimal production.
Thus, while low unemployment is celebrated as a marker of economic strength, its interpretation requires nuance. It must be assessed against broader macroeconomic conditions, cyclical dynamics, and historical experience. A rate that signals prosperity in one context may, in another, foreshadow inflationary strain or structural imbalance.
Production Possibility Curves
Conceptualizing Production Possibility Frontiers
The production possibility curve (PPC) or production possibility frontier (PPF) offers a structured way to think about the limits of an economy’s productive capacity. The curve maps out the maximum attainable combinations of goods that can be produced within a given period assuming:
- Fixed resources. The total quantity and quality of available resources, such as labor, capital, natural resources, and entrepreneurial talent, are constant over the period of analysis.
- Fixed technology. The state of technological knowledge and production techniques remain unchanged.
- Full employment. All available resources are fully and efficiently employed in the production process. Under conditions of full employment, the economy operates on the PPC.
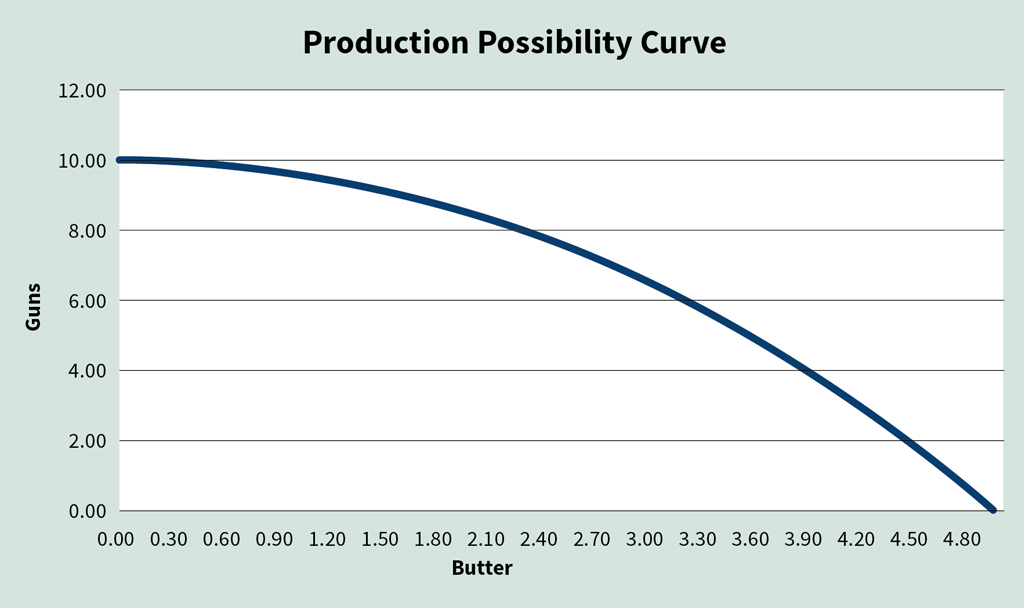
To make the analysis tractable, economists often reduce the complexity of production choices to a two‑good model. The familiar “guns and butter”2 example illustrates the tension between civilian and military production and goes along the following lines: Suppose that five units of butter3 is the maximum amount that can be produced with existing technology. At the other extreme, imagine that if all of society’s resources were devoted to the production of guns, 10 units would be manufactured. Points between these extremes represent alternative allocations where resources are shifted between the two goods. At one extreme, dedicating all resources to butter yields a maximum of five units, while at the other, full commitment to guns produces 10 units.

Never confuse activity with productivity.
—Rick Warren
The deeper insight of the PPC lies in its portrayal of scarcity, efficiency, and the trade‑offs economies must take. In a fully employed economy, producing more of one good necessarily requires producing less of another. This inverse relationship embodies the principle of opportunity cost—the value of the next-best alternative that must be forgone. The slope of the curve at any point captures this cost, expressing how much of one good must be sacrificed to gain an additional unit of the other.
Understanding how the PPC responds when its underlying assumptions are relaxed is essential for interpreting real-world economic dynamics. The curve is not static; it expands, contracts, or becomes more complex depending on changes in resources, technology, employment, and the scope of goods considered.
- Resource endowments. The PPC reflects the productive capacity of an economy, so changes in resource availability directly alter its position. An expansion of resources—through population growth, capital accumulation, or the discovery of new natural inputs—pushes the curve outward, signaling greater potential output. Conversely, resource depletion, war, or natural disasters contract the frontier inward, reducing the economy’s ability to produce across all goods.
- Technological change. Technology determines how efficiently resources are transformed into output. Advances in knowledge or production methods shift the PPC outward, enabling more goods to be produced with the same inputs. On the other hand, a regression in technology or restrictions on its use can move the curve inward, reflecting diminished efficiency.
- Employment of resources. The assumption of full employment places the economy on the frontier itself. When resources are underutilized—due to unemployment or inefficiency—the economy operates inside the PPC rather than on it. The curve remains unchanged, but actual production falls short of potential.
- Expanding beyond two goods. The two-good framework is a simplification for analytical clarity. Relaxing this assumption does not shift the curve but complicates its representation. With multiple goods, the PPC becomes a higher-dimensional surface, capturing the trade-offs among many possible combinations rather than just two.
Rising Costs and Resource Allocation
The outward curvature of the PPC reflects the fact that resources are rarely equally adaptable across all forms of production. As an economy pushes further into the output of one good, it must increasingly draw on inputs that are less well‑suited to that activity. The result is a growing sacrifice in the production of alternative goods. In practical terms, the first units of military equipment might be produced using resources that contribute little to civilian consumption, yet as production expands, resources that are highly effective in producing butter must be redirected toward guns, amplifying the trade‑off.
Efficiency Gains and Economies of Scale
Before rising costs dominate, production often benefits from efficiencies associated with scale. Larger operations, standardized processes, and specialized labor can reduce average costs, a phenomenon captured by the concept of economies of scale. These gains, however, are limited. Once the most efficient facilities are in place and no further scale advantages can be realized, the economy confronts the familiar law of increasing costs. In the guns‑and‑butter example, early expansion of gun production may exploit scale efficiencies, but beyond a certain threshold, the trade‑offs reassert themselves.
Diminishing Returns and Marginal Productivity
A related dynamic is the law of diminishing returns. When one input is expanded while others remain fixed, the additional output generated by each new unit of input eventually declines. For instance, adding more labor without expanding land or capital will yield progressively smaller increases in production. This principle reinforces the rising costs observed along the PPC, as reallocating resources across sectors rarely produces proportional gains.
International Trade Under Full Employment
The intellectual foundations of comparative advantage were laid most prominently by David Ricardo4 and later refined by John Stuart Mill,5 among others, as part of a broader effort to explain the logic of international exchange. Their work established comparative advantage as a principle with enduring relevance to policy debates. When articulated in its rigorous form, the argument is unassailable under the assumption of full employment, and it continues to carry considerable weight even in economies where unemployment persists at modest levels. The durability of the theory lies in its ability to demonstrate that relative efficiency, rather than absolute productivity, is the decisive factor in shaping mutually beneficial trade.

Logic: The art of thinking and reasoning in strict accordance with the limitations and incapacities of the human misunderstanding.
—Ambrose Bierce
When comparing the productive capacities of nations, it becomes clear that differences in resource endowments—land, capital, labor, and technical expertise—shape the range of goods each country can feasibly produce. Although it is theoretically possible for every nation to attempt the production of all commodities, the reality is that such efforts often prove inefficient or prohibitively costly. Economic logic therefore favors specialization: Countries concentrate on the goods they can produce most efficiently and rely on trade to obtain the rest.
The counterintuitive insight of comparative advantage is that trade can generate mutual gains even when one country is more efficient across the board. A nation with absolute advantage in every sector does not eliminate the possibility of beneficial exchange. What matters is relative efficiency. Even the less efficient country will find areas where its disadvantage is least severe, and in those sectors it holds a comparative advantage. Conversely, the more efficient country maximizes its gains by focusing on industries where its superiority is greatest, while importing goods that its partner can produce with relatively lower inefficiency.
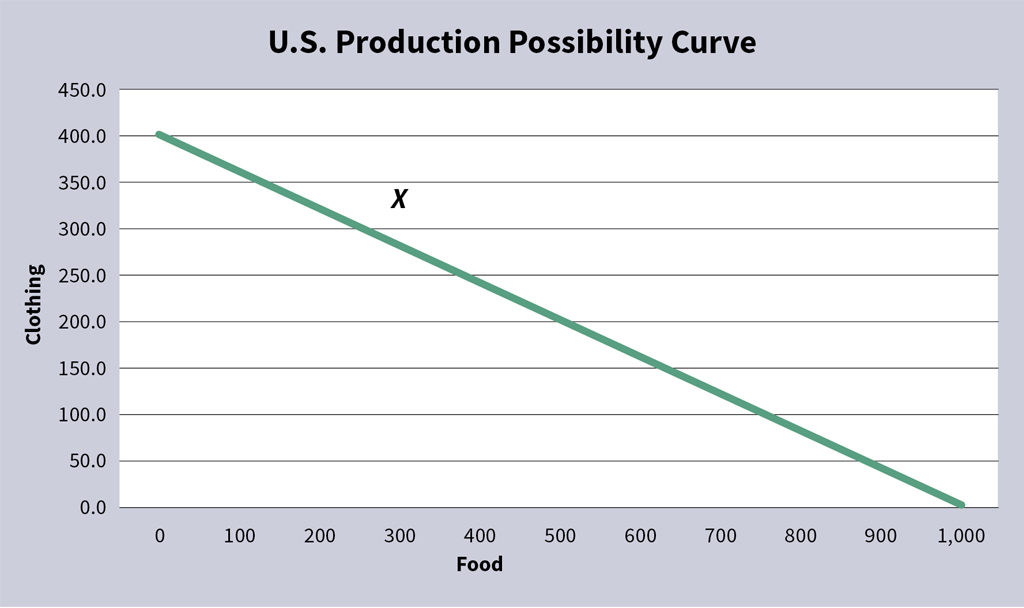
A historical illustration can be drawn from the 19th‑century economic relationship between the United States and the United Kingdom. The U.S., endowed with abundant land and natural resources, faced relative scarcity of labor and capital. Britain, by contrast, possessed a surplus of labor and capital but limited land.6 These asymmetries shaped production choices: food production was relatively cheaper in the U.S., while clothing production was relatively cheaper in the U.K. The policy debate in the U.S. over protective tariffs thus hinged on whether restricting imports would improve welfare or whether specialization and trade would yield greater efficiency.
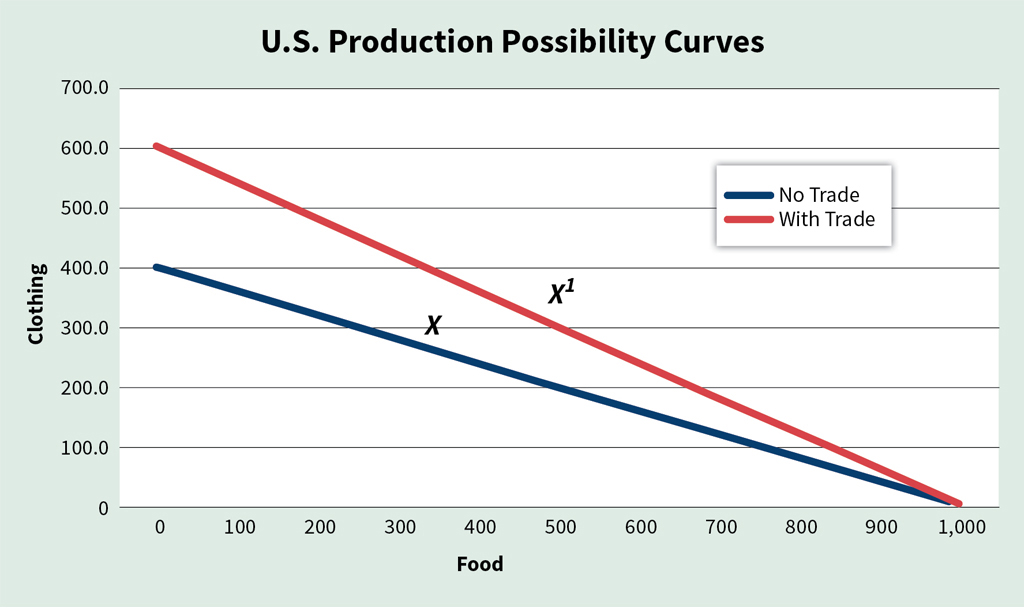
To formalize the example, assume that in the U.S. the opportunity cost of producing clothing is four units for every 10 units of food forgone. If all resources (factors of production7) were devoted to food, the economy could produce 1,000 units. In a self‑sufficient equilibrium, represented by point X, the U.S. produces and consumes 300 units of food and 280 units of clothing. This allocation reflects the workings of the price mechanism, where supply and demand determine the mix of goods.
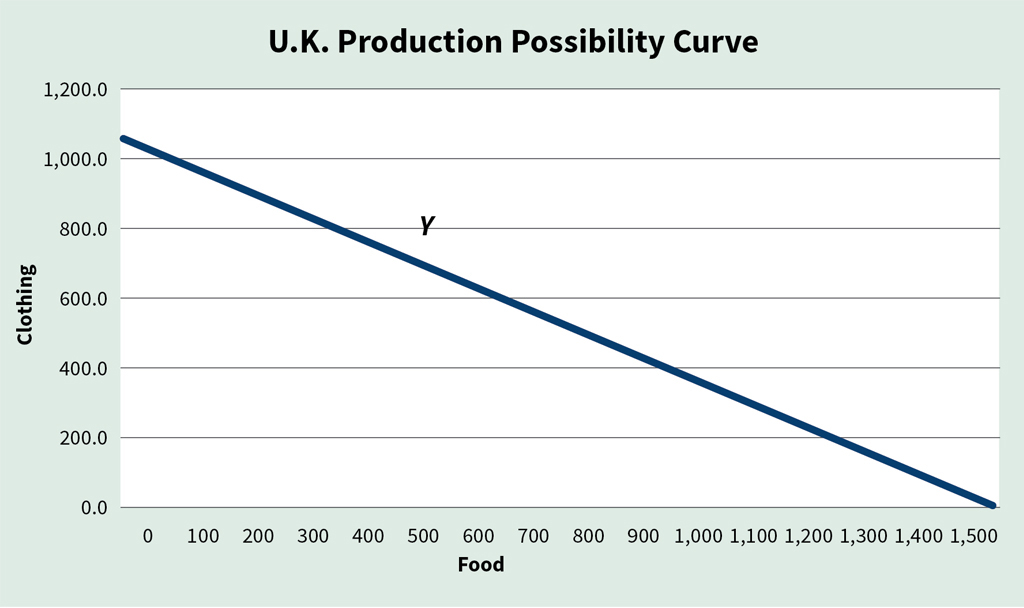
In the U.K., the trade‑off differs: Diverting 10 units of food allows the production of seven units of clothing. At equilibrium point Y, the U.K. produces 700 units of clothing and 500 units of food. The critical distinction lies in the opportunity‑cost ratios—10:48 in the U.S. versus 10:7 in the U.K.—which reveal the basis for comparative advantage. The U.S. is relatively more efficient in food production, while the U.K. is relatively more efficient in clothing. Trade between them, therefore, allows both to consume beyond the limits of their domestic production frontiers.
Free Trade and Terms of Exchange
When nations move from self-sufficiency to international exchange, the terms of trade are set not arbitrarily but through the interplay of global supply and demand.9 For trade to be mutually beneficial, these ratios must fall between the opportunity costs faced by each country in autarky.10 In the U.S., the domestic trade-off is 10 units of food for four units of clothing, while in the U.K. it is 10 units of food for seven units of clothing. If the global price ratio were less favorable than these domestic benchmarks—say 10:1 for the U.S. or 10:9 for the U.K.—neither country would have an incentive to participate since they could achieve better terms internally.
Now consider a world-market equilibrium at 10:5. This ratio lies between the autarkic costs of both nations, creating scope for gains from trade. The U.K., with its relative efficiency in clothing, specializes in textile production and exports five units in exchange for 10 units of food. This outcome improves upon its domestic conversion rate of 7:10. Conversely, the U.S. specializes in food, trading 10 units for five units of clothing—a more favorable exchange than the four units attainable under self-sufficiency. Both countries thus expand consumption possibilities beyond their domestic production frontiers.
Another counter-intuitive consequence of trade based on comparative advantages is that the economic benefits are not determined by wage levels;11 rather, in the absence of distorting factors such as price controls, wages adjust upward toward productivity in export sectors, not downward toward import-competing industries.12
Efficiency and Technological Progress
Trade gains are not static; they evolve with changes in productivity. Suppose a technological advance in the U.S. raises food output, improving its opportunity-cost ratio from 10:4 to 10:6. The production-possibility frontier shifts outward, allowing simultaneous increases in food and clothing. This innovation also alters the international terms of trade. If the U.S. can now offer 10:6 while the U.K. remains at 10:7, the equilibrium ratio may settle at 10:6. Under these conditions, the U.S. secures more clothing per unit of food exported, while the U.K. sacrifices fewer textiles to import food. Should both nations experience productivity gains, the benefits compound, reinforcing the dynamic link between technological progress and expanded trade possibilities.
Terms of Trade and Reciprocal Demand
John Stuart Mill advanced the classical theory of trade by introducing the principle of reciprocal demand, which explains how exchange ratios between nations are determined. Mill’s insight was that comparative costs alone do not dictate the terms of trade; rather, the equilibrium ratio emerges from the interaction between those cost boundaries and the relative intensity of each country’s demand for the other’s goods. In this framework, three elements shape the outcome.
First, comparative cost ratios establish the outer limits of possible exchange following Ricardo’s logic that nations specialize in the goods they can produce at the lowest opportunity cost. Within those limits, the balance of reciprocal demand determines where the actual terms of trade settle. A country with stronger demand for its partner’s exports will, ceteris paribus, concede more of its own goods, shifting the exchange rate in favor of the other. Finally, elasticity of demand13 plays a decisive role: nations with inelastic demand for imports are forced to accept less favorable terms, while those with highly elastic demand can negotiate closer to their own advantage. Mill’s contribution was to integrate supply-side constraints with demand-side responsiveness, producing a more dynamic account of how trade ratios are set in practice.
Extension to Multiple Goods and Countries
The logic extends naturally beyond the two-good, two-country model. When nations produce a range of commodities, these can be ordered by relative advantage. For example, if the United States holds its strongest comparative edge in Commodity 1 and the United Kingdom in Commodity n, liberalized trade will push each toward specialization at opposite ends of the spectrum. The intermediate goods fall along a continuum, with the dividing line determined not by cost ratios alone but by the global demand schedule for each product. Aggregate supply and demand across world markets jointly establish the threshold at which production shifts from one country to another.
Adding more countries does not alter the underlying mechanism.14 From the perspective of any single nation, the rest of the world can be treated as a composite trading partner, and the same principles of cost boundaries, reciprocal demand, and elasticity apply. Within larger trading blocs, subregions interact according to the same logic, reinforcing Mill’s point that international trade is governed by both productive efficiency and the structure of global demand.

I am so clever that sometimes I don’t understand a single word of what I am saying.
—Oscar Wilde
Final Remarks
At its foundation, international trade rests on the recognition that exchange across borders generates mutual gains rather than constituting a zero-sum contest.15 Whether economies operate under full employment or face pockets of under-utilized labor, prevailing theory consistently emphasizes the efficiency of free trade. The principle of comparative advantage anchors this logic: nations specialize in sectors where their relative efficiency is greatest, thereby unlocking productivity gains, fostering innovation, and widening the scope of consumption possibilities. In this way, trade functions as a catalyst for globalization and a mechanism for raising living standards.
To formalize the limits of production, economists employ the PPC. This framework traces the maximum feasible combinations of goods under the assumption of full employment, embedding the concepts of scarcity and opportunity cost. The slope of the curve captures the trade-off between goods, while its outward concavity reflects rising costs—resources are rarely perfectly transferable across different forms of production.
For trade to deliver net benefits, the terms of exchange must fall between the domestic opportunity costs of the participating nations. The precise equilibrium ratio is not dictated by costs alone but emerges from reciprocal demand: the interplay between comparative cost structures and the relative intensity and elasticity of each country’s appetite for the other’s exports. In this synthesis of supply and demand, the profitability of trade is determined, and the benefits of comparative advantage are realized in practice.
The analysis of trade under unemployment and the strategic use of tariffs are the subject of a subsequent article.
Key Points
- Comparative advantage shapes specialization and mutual gains, even when absolute efficiencies differ.
- Production possibility curves highlight scarcity, opportunity cost, and resource trade-offs.
- Full employment maximizes output, but tight labor markets can drive scarcity, inflation, and productivity risks that affect actuarial assumptions.
- Terms of trade—set by global supply, demand, and efficiency—impact pricing, returns, and risk exposure.
- Actuaries can use these insights to model claims volatility, quantify macroeconomic risk, and stress-test portfolios.
Carlos Fuentes, MAAA, FSA, FCA, MBA, MS, is president of Axiom Actuarial Consulting. He can be reached at [email protected].
Endnotes
- Interpreting data can be tricky. Consider the following unemployment rates: Mexico 2.7%, U.S. 4.1%, Germany 6.3%, Israel 2.7%, Japan 2.5%. Yet, the informal employment rates are 54.8% in Mexico, 17.7% in the U.S., 14.5% in Germany, 25.4% in Israel, 10.3% in Japan).
- The metaphor is simple, memorable, and frequently utilized to describe the PPF. It is also useful in many contexts such as in discussions of geopolitical tensions, economic policies, global challenges, and public debates.
- Units of butter can be one pound, one thousand pounds, one million pounds or any amount that is suitable for the example at hand. The fact that there are many variations of butter is ignored. Similar considerations apply to units of guns.
- David Ricardo (1772-1823) was a British political economist and politician. He is known for his theories on comparative advantage, economic rent, and the labor theory of value. His work laid the foundation for classical economics.
- John Stuart Mill (1806-1873) was an English philosopher, political economist, and civil servant. He was a proponent of utilitarianism and contributed to social theory, political theory, and political economy.
- The metaphor of food and clothing is simple and memorable. It is often used to illustrate fundamental concepts such as comparative advantage, opportunity cost, and the benefits of international trade.
- Factors of production are essential inputs used in the production of goods and services. They are typically classified into four categories: (1) land: natural resources, such as water, minerals, forests, and agricultural land; (2) labor: human effort, skills, and time contributed to the production process; (3) capital: manufactured tools, machinery, buildings, and equipment used to produce goods; (4) entrepreneurship: the initiative, innovation, and risk-taking of individuals who organize the other factors to create and run businesses.
- A constant ratio implies that the production possibility curve is a straight line. This assumption simplifies the analysis but does not affect the validity of the argument because costs still increase as production expands.
- See “The Dynamics of Market Forces-Setting the Stage” in the May-June 2025 issue of Contingencies, and “The Dynamics of Market Forces-Squaring the Circle” in the July-August 2025 issue.
- Economic independence or self-sufficiency.
- Assumptions about wage levels or wage relativities are not required in this analysis.
- To give an example: manufacturing wages in Mexico tend to be higher for employees working in American companies vis-a-vis Mexican companies.
- Elasticity of demand measures how the quantity demanded of a good changes in response to a change in its price. If demand changes significantly with a small price change, demand is elastic; if demand changes little with a price change, demand is inelastic.
- Consider the inefficiencies that would result if each state (in the U.S.) were to apply tariffs to other states. Conversely, consider the economic benefits that free trade between states generates.
- In game theory and economics, a zero-sum game describes a strictly competitive interaction. If one side wins, the other side loses by the same amount, leaving no possibility of mutual gain.
Disclaimer: This article is based on established economic theory. The discussion is interpretive and does not purport to advance new theoretical contributions.