By Stephen Meskin
There is a well-known problem in mathematical folklore that’s been around at least 75 years. “Prove that at a party of six people, there are either three mutual acquaintances or there are three mutual strangers.” Of course, after 75 years we would hope that they would all be well acquainted.
This problem is often posed in an introduction to Graph Theory. Translating the problem into Graph Theory, each of the six people at the party is a vertex of a graph, G. For each pair of vertices (people), there is a unique line between them which is an edge of G.[1] (We use the pair of vertices to denote their edge.) From the six vertices of G, we obtain 15 edges. (This graph is the complete graph of order[2] six, denoted K6.) We color-code each edge of G depending on the relationship between the two people represented by the pair of vertices defining that edge. If the two people are acquainted, we code their edge blue but if they are strangers, we code their edge red.
The old problem now reads: Prove that if the edges of K6 are variously colored blue and red, then there is a blue triangle[3] or a red triangle.
Proof: Choose any vertex, V. There are five other vertices in K6 and so there are five edges coming out of V. Of these, at least three edges must be of the same color. Without loss of generality (WLOG), assume that the three edges are blue. One end of these three blue edges is V; let the vertices at the three other ends be X, Y, and Z. If edges XY, YZ, and ZX are all red, then they form a red triangle. If not, then one of this latter set of edges must be blue. WLOG assumes it is edge XY. Then VX, XY, and YV form a blue triangle. QED
The above proves that R(3,3) < 6, where R(m,n) is the Ramsey number for m and n. Problem 1, below, asks you to prove that R(3,3) > 5 and thus R(3,3)[4] = 6.
Problem 1
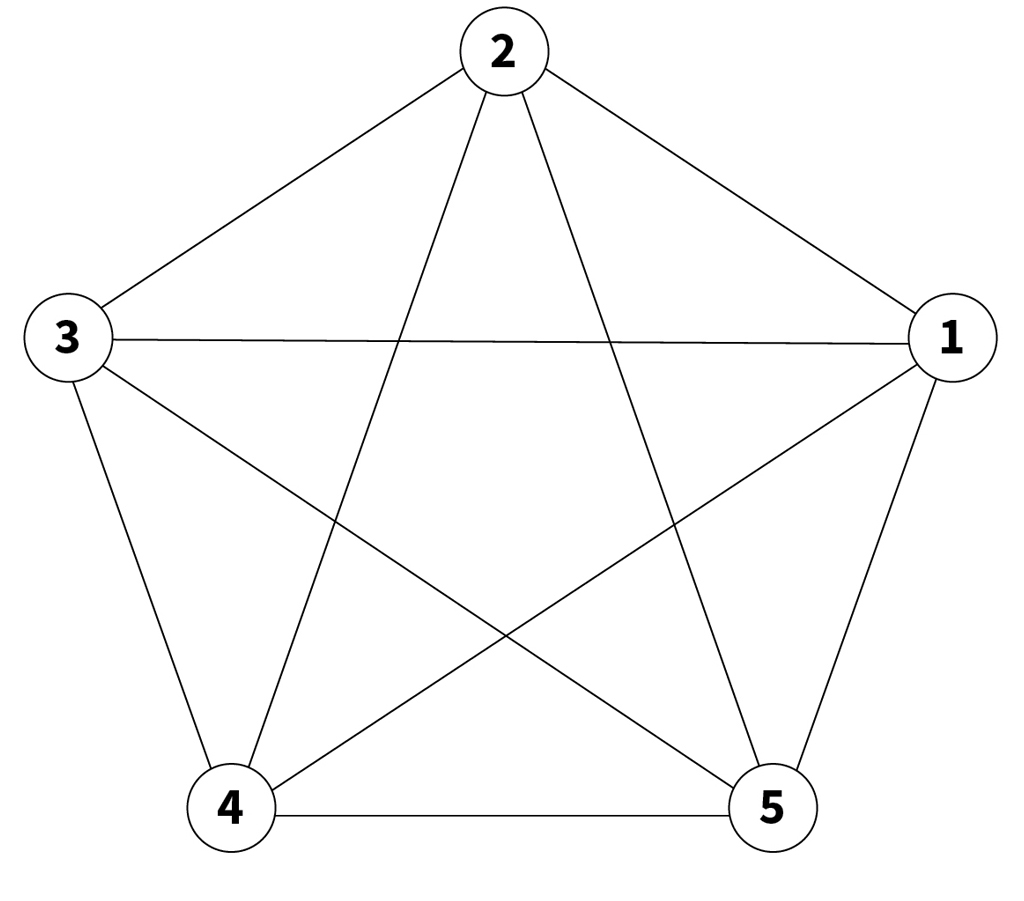
Show that the edges of K5, (the complete graph of order five) can be colored blue and red with no monochromatic triangles. (See the diagram for a picture of K5 without color.)
Instead of saying “a blue triangle or a red triangle,” I said a “monochromatic triangle,” thus simplifying the following problem statement.
Problem 2
Prove that if the edges of K6 are variously colored blue and red, then there are two monochromatic triangles. (The two triangles could both be blue, both red, or one blue and one red.)
The Problem 2 proof is like the proof of the old problem shown previously. Both proofs require you to show that you are forced to create colored triangles no matter what coloring choices you make. They are the opposite of Problem 1 where you are asked to color a single graph without any colored triangles.
In doing your Problem 2 proof you may want to visually represent a graph, G, by drawing it in the plane. To do so, you would represent each vertex of G by a point, and then, for each edge uv of G, you would draw a curve that connects the point representing u with the point representing v. The positions of the points and the shapes of the curves can be chosen freely, as long as they allow the reader to unambiguously reconstruct the graph G from the picture. (Thus, for example, curves should only pass through each other at points that are NOT vertices. See the drawing of K5.)
Solutions may be emailed to puzzles@actuary.org.
In order to make the solver list, your solutions must be received by Oct. 1, 2025.
The Pickleball Slam Solutions
- What is the probability the final score ends up 15 to 14? This is a two-part question. First, you need to figure out the probability someone will hit score 14 with the opponent at scores 0, 1, 2…. all the way to 13. We can do this using the Binomial Distribution. Second, for each score, we need to figure out what comes first, the server winning two points in a row or the trailing competitor reaching 14 points. We can do this recursively. If the score is 14-13, we know that there is a 0.5 probability the receiver will win the next point and force a 14-14 tie. If the score is 14-12, there is a (0.5)2 chance the losing player will win the next two points, and there is also that same 0.25 probability that the trailing player will win the next point and lose the following point, bringing us to the 14-13 score scenario. Playing this out for every scenario, we can do the calculations and see that the probability the final score ends at 15-14 is approximately 24.9%.
- What is the mean number of points played in a set? We can use our work from above to figure out the distribution of final scores ranging from 15-0 all the way to 15-14. To figure out the mean number of points if the match ends 15-14, realize that there is a 0.5 probability the server will win the next point, creating exactly 29 points in the set. The probability of there being 30 points in the set is 0.5 (the server losing the point at 15-14) 8 0.5 (the server winning the second point), or 0.25. We can continue this out for all additional scores, and see that if the match hits 15-14, there will be on average 32 points in the set. Combining this with our calculations for sets that don’t hit 15-14, we can see that the mean number of points in a set is 26.1 points.
- How do the above numbers differ if the server has a 45% chance of winning the point? This turned out to be a lot tougher than intended. We know that both numbers will be larger that what we computed above, but by how much? Likely the easiest way to solve this is via simulation. We can easily set up a sample ‘set’ in Excel, creating a random number to predict who will win each point, and then computing the final score and the total number of points for that set. Once you have this basic format down, we can copy each row a bunch of times to simulate a set and get the probability of the match reaching the score 15-14 and the mean number of points in a set. Doing this leads to answers of 29.3% probability the match will end 15-14 and 26.5 mean number of points.
Solvers: Rui Gio, Chi Kwok, Daniel Wade, Clive Keating, Tony Pistilli, David Promislow, Bill Feldman, and Bob Conger. Bob Conger was inadvertently left off the solver’s list for the previous puzzle.
Endnotes
- Formally a graph is defined as a pair of sets: a set of vertices and a set of pairs of vertices, the edges.
- The order of a graph is the number of its vertices.
- A triangle is K3, a complete graph of order 3.
- R(4,4)=18 but the exact value of R(5,5) is unknown, but it is known that 43<=R(5,5)<=46.