
By Michael Winkler and Sunil Kansal
Find out how IFRS 17 discount rates determine present value and influence reported liabilities, as well as the practical challenges insurers face in deriving and applying them across markets.
This article provides an overview of the issues involved in determining the time value of money (i.e., the discounting in the IFRS 17 accounting framework). The concept of discounting future cash flows has not been consistently applied in previous standards; for example, many non-life insurance companies did not discount their reported claims reserves to keep a conservative margin. In IFRS 17, discounting is consistently applied to all long-term cash flows. The discount rates are supposed to reflect only financial risks whereas an explicit margin for nonfinancial risks—the so-called Risk Adjustment—is added to the liabilities. In several markets, deriving reasonable discount rates is challenging given the limited availability of suitable market data.
A sum of money currently available now has a greater value than the same sum to be paid in the future because of its earnings potential in the interim. This so-called time value of money is a core principle of finance and is reflected in IFRS 17. Therefore, suitable discount rates must be applied to the projected future cash flows.
According to IFRS 17, appropriate discount rates applied to the estimates of future cash flows must:
- reflect the time value of money, the characteristics of the cash flows, and the liquidity characteristics of the insurance contracts;
- be consistent with observable current market prices (if available) for financial instruments with cash flows whose characteristics are consistent with those of the insurance contracts, including timing, currency, and liquidity; and
- exclude the effect of any factors influencing such observable market prices that do not affect the future cash flows of the insurance contracts.
Basis Rules to Derive Discount Rates
Under Solvency II, a European regulatory framework that sets capital requirements and risk management standards to ensure insurers can meet their long-term obligations, the Matching Adjustment (MA) enables insurers to adjust the risk-free interest rate used for discounting specific long-term insurance liabilities. This adjustment incorporates the illiquidity premium associated with holding less liquid assets that are closely aligned with the cash flows of these liabilities.
In contrast, IFRS 17 does not impose explicit restrictions on the selection of the reference portfolio. Insurers have the flexibility to use their own asset portfolios, provided the resulting discount rates appropriately reflect the characteristics of the insurance contracts and are consistent with observable market data.
Furthermore, similar to the Volatility Adjustment in Solvency II, discount rates can be derived by starting with risk-free rates and adding an allowance for illiquidity,
We therefore end up with two approaches to setting the discount rate, namely the “top-down” and “bottom-up” approaches:
- The top-down approach is based on a yield curve that reflects the current market rates of return implicit in a fair value measurement of a reference portfolio of assets and is adjusted to eliminate any factors that are not relevant to the insurance contracts.
- The bottom-up approach is based on adjusting a liquid risk-free yield curve to reflect the differences between the liquidity characteristics of the financial instruments that underlie the risk-free rates observed in the market and the liquidity characteristics of the insurance contracts.
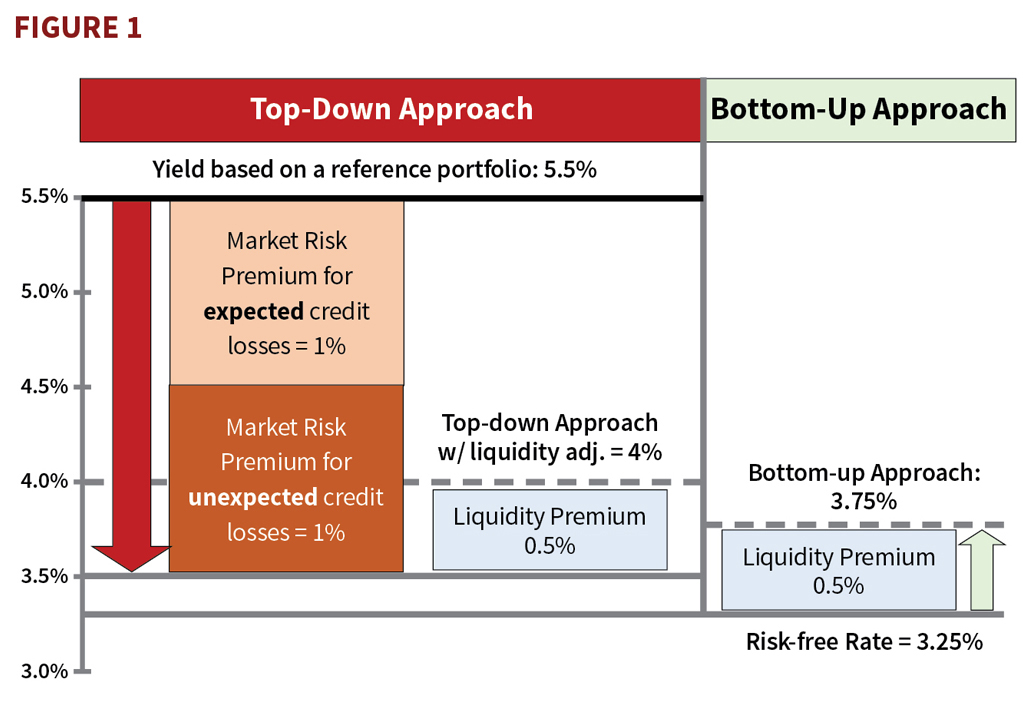
See the example in Figure 1.
Most companies use a bottom-up approach often very closely aligned with the Volatility Adjustment used in Solvency II. However, there are some exceptions:
- Aegon has generalized the two approaches into a unified direct discounting technique, where discount rates are determined as the sum of the risk-free rate plus a percentage of the (product-specific) illiquidity premium.
- Aviva and Phoenix (U.K.) use a top-down approach for annuities, incorporating the Matching Adjustment as in Solvency II.
Cash flows that vary based on the returns on any financial underlying items—for example,when applying the Variable Fee Approach (VFA) for direct participating business—shall be:
- Discounted using rates that reflect that variability; or
- Adjusted for the effect of that variability and discounted at a rate that reflects the adjustment made.
Option 1 aligns with a real-world valuation framework, which aims to produce a realistic view of potential future economic variables. In this framework, discount rates for variable cash flows reflect the projected rates of return on the underlying items (asset-based discount rates).
Option 2 permits a rate of return on underlying items which is not necessarily a real-world framework. Here, cash flows are adjusted to ensure consistency, and the framework relies on mathematical relationships among financial instruments. This may include risk-neutral valuation, where risk-free rates of return (with or without liquidity premium) are used both to project the underlying items and to discount the cash flows.
Challenges
A notable challenge for many insurers is the duration and yield mismatch between the company’s own portfolio and a marketreferenced portfolio, particularly when long-dated liabilities are paired with medium-term matching assets. In such cases, applying a liquidity premium based on the entity’s own portfolio can lead to meaningful outcomes:
- Scenario 1: If the insurer holds highly illiquid assets with long-term horizons, these typically offer yields and coupons significantly above market averages. Consequently, the discount rate applied to insurance liabilities is higher, leading to lower reported liabilities.
- Scenario 2: Conversely, if the insurer has invested in low-yield assets in a high-interest-rate environment, the discount rate would be lower, resulting in higher reported liabilities.
Furthermore, currency and term mismatches introduce additional complexities, particularly in product lines such as annuities or whole-of-life contracts, where liability durations often exceed the maturity profiles of available matching assets.
Concrete Implementation
Actuarial guidance provides a practical framework on how to derive the IFRS 17 discount rates in practice:[1]
- Establish the last observable point on the yield curve: Use observable market prices where available in active markets.
- Set the ultimate risk-free rate: Develop unobservable inputs using the best available information and place more weight on long-term estimates than short-term fluctuations.
- Set the liquidity premium: The discount rates reflect the characteristics of the insurance contracts, including liquidity.
- Set discount rates for products containing cash flows that vary with an underlying item.
The last observable point corresponds to the term of the asset with the longest maturity that has a quoted price from an active market (a market in which transactions for an asset take place with sufficient frequency and volume to provide pricing information on an ongoing basis). To determine market activity, consider factors such as bid-ask spread, trading volume, trade size, and the impact of trades.
When setting the discount curve beyond the last observable point, consider the following characteristics:
- Stability: The ultimate interest rate would be more stable over time (on average, one might expect the variability of long-term interest rates to be lower than short-term rates).
- Smoothness: Interpolated rates would follow a smooth path from the last observable point to the ultimate long-term rate.
- Simplicity: The approach would be easy to understand and implement.
Setting the liquidity premium is not straightforward. Market-based methods often use the spread difference between covered bonds and risk-free bonds in the same currency. However, due to missing liquidity and longer-term durations of the corresponding instruments, this approach may not be feasible in many markets.
Most European companies base IFRS discount rates on Solvency II rates, which are consistent with IFRS 17. Euro rates are typically based on market rates up to 30 years, in contrast to the European Insurance and Occupational Pensions Authority (EIOPA) rates, where the extrapolation to the ultimate forward rate starts much earlier. As a result, Euro rates are expected to react more in line with the asset movements. For portfolios with less liquid liabilities, such as annuities in payment, insurers add significant illiquidity premiums. Portfolios measured using the VFA use more conservative discount rates.
In developing markets, companies often struggle to determine discount rates based on observable market data. Risk-free rates may not exist and neither do long-term investments: The longest duration may be a few years or even less than a year. In such cases, applying any sophisticated methodology like those described above, does not make sense. The primary reference point is typically the long-term investment return the company can achieve, less an allowance for unexpected losses. An exception occurs in countries whose currency is pegged to the U.S. dollar or another leading currency with long-term rates; in these cases, companies usually take those rates as a starting point.
Changing Discount Rates
For each accounting period, the discount rates must be updated in line with market movements, since companies are required to use current assumptions. For long-term liabilities, this can have a significant impact on the time value of money and, as a result, on the fulfilment cash flows.
Companies can specify in their accounting policy whether the impact of changes in market discount rates is recognised in profit and loss (P&L) or in Other Comprehensive Income (OCI). In the latter case, interest is accrued to the P&L at the discount rate set at inception.
At first glance, OCI may appear to be a better choice because the volatility stemming from updated discount rates would not distort the P&L. However, changes in the fair value of some assets, particularly those used for interest rate hedging, always flow through the P&L. A careful analysis should be made to determine the most appropriate choice for a given company.
Observations
In the Solvency II environment, discount rates published by EIOPA provide a natural reference point. In a survey conducted by EIOPA, 42% of respondents reported using the same or nearly the same rates, while the remaining 58% typically applied higher discount rates than under Solvency II.[2]
- About 58.5% of respondents use the same risk-free rate as in Solvency II. For those who do not, the main differences relate to a more remote last liquid point (for example, 30 years for the Euro) and a different ultimate forward rate.
- There are some further observations in countries around the world: In developing markets with local currencies pegged to the U.S. dollar, companies normally use U.S. dollar rates with a particular uplift.
- Some companies vary the discount rates by product type. For example, in many cases the discount rates for annuities in payment are significantly higher than those typically derived from the yield of the asset portfolio backing the specific liabilities (“top-down”) and include a higher illiquidity premium.
- Many companies use different rates for the General Model (GMM) and the Premium Allocation Approach than for the Variable Fee Approach (VFA), with VFA rates being more conservative.
- Disclosures of the discount rates vary by company: most indicate the rates used for certain durations (for example, 1, 5, 10, 20, and 30 years), some publish an ultimate rate for exceptionally long durations, while others report only a range (either by duration buckets or overall).
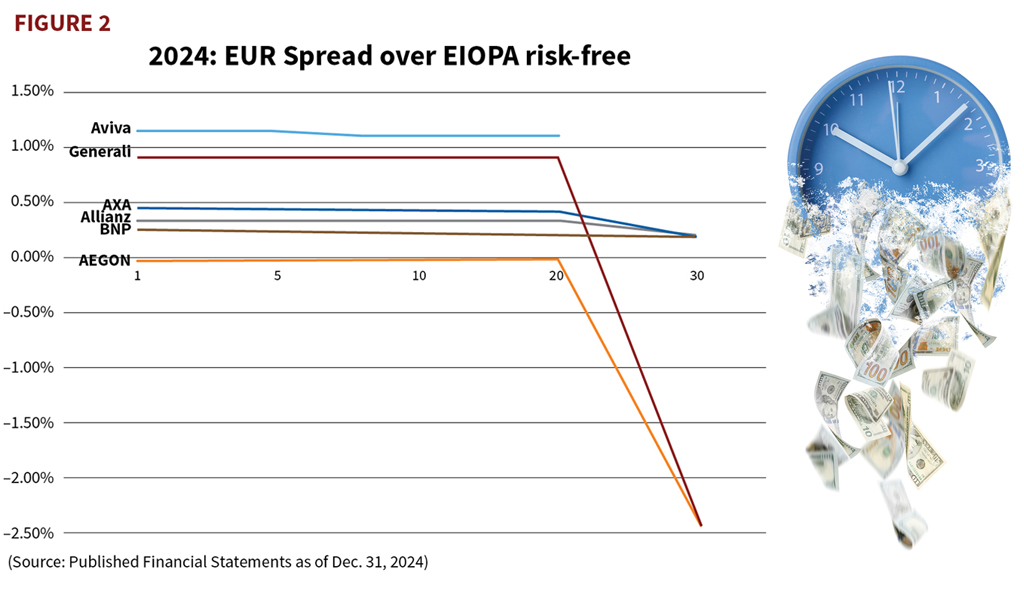
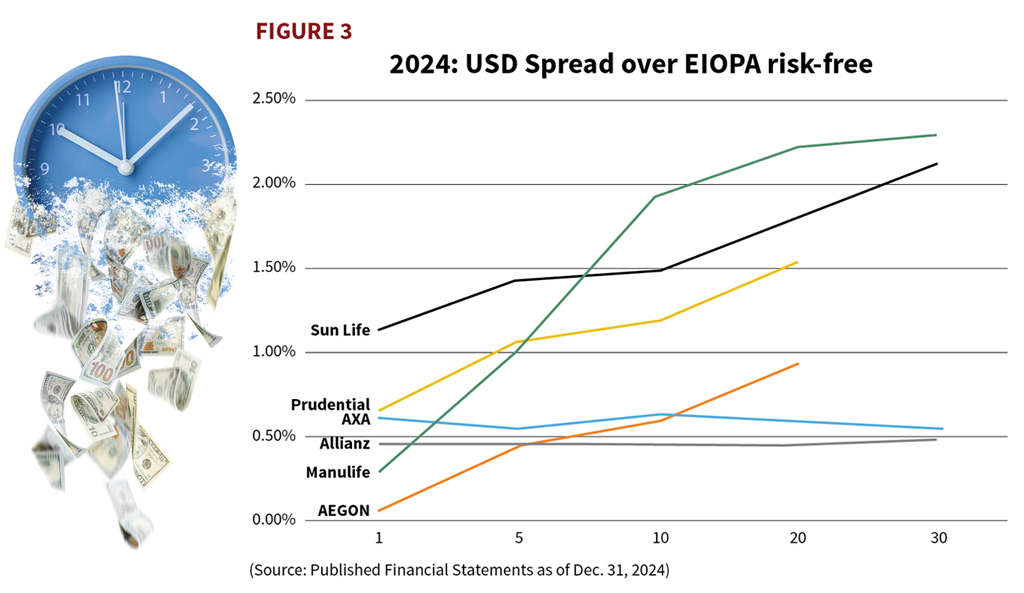
The spreads in discount rates used by sample companies vary significantly. Figures 2 and 3 for year-end 2024, compare the discount rates with the risk-free rate published by EIOPA for Solvency II purposes.
The spreads in Euros (EUR) are relatively constant but appear to drop for durations longer than 20 years. This effect is largely artificial, stemming from different extrapolation methods for long durations, as EIOPA rates converge toward the Ultimate Forward Rate.
In contrast, U.S. dollars (USD) spreads used by various companies seem to increase with duration in most cases, although several companies do not disclose discount rates for long durations.

Some companies initially decided to use average rates for their interest-sensitive business that did not accurately reflect the actual pricing rates for different cohorts. This seemed to be a reasonable simplification, given the administrative burden of maintaining multiple sets of yield curves over time. However, in many cases, cohorts turned onerous despite having reasonable pricing margins in reality.
We therefore strongly recommend analysing the quantitative impact of such “simplifications” as early as possible.
Michael Winkler is an actuary (SAA/DAV) at RefinSol and Shasat Consulting and has previously held senior actuarial positions at Swiss Re, Munich Re/New Re, and Winterthur Group. Sunil Kansal, Head of Consulting at Shasat, is a chartered accountant and a Fellow of the Institute of Chartered Accountants in England and Wales. They are authors of the book, Navigating IFRS 17: A Practical Guide to Accounting & Actuarial Implementation.
Endnotes
- Canadian Institute of Actuaries: Draft Educational Note / IFRS 17 Discount Rates for Life and Health Insurance Contracts, June 2020
- EIOPA: “IFRS 17 – Insurance contracts report”, April 2024